RTX 5060 vs Arc B580: specs, benchmarksutra scores and prices at our partner stores, checked 12 November 2026.
Quick Verdict
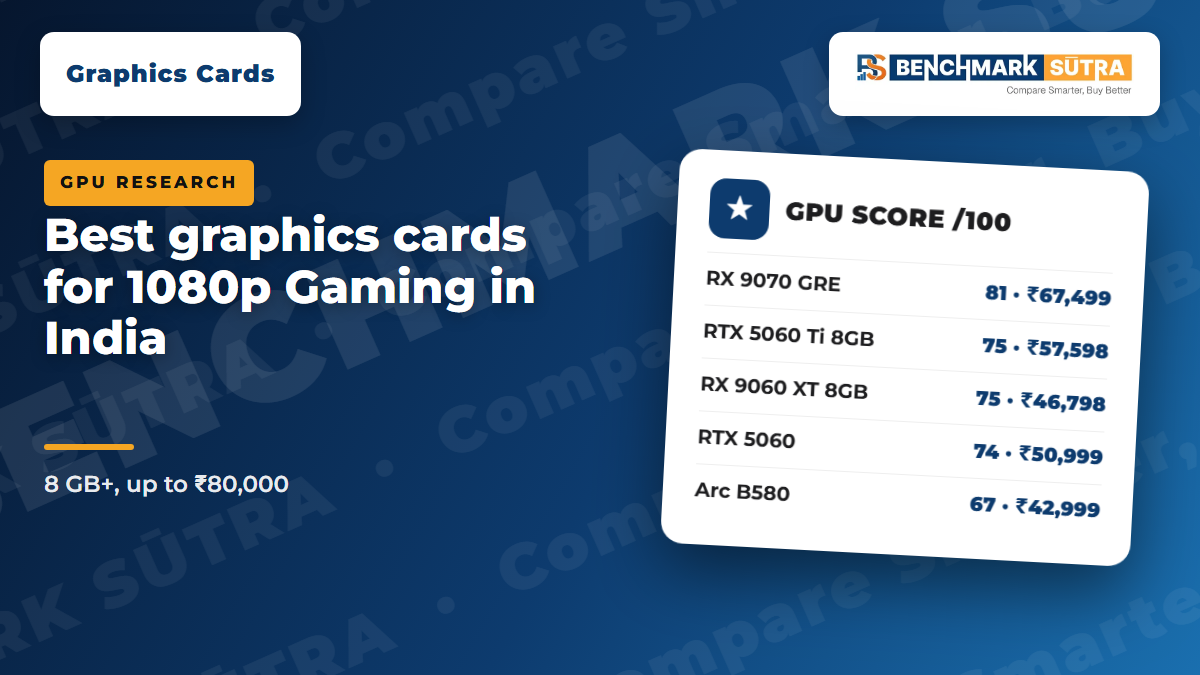
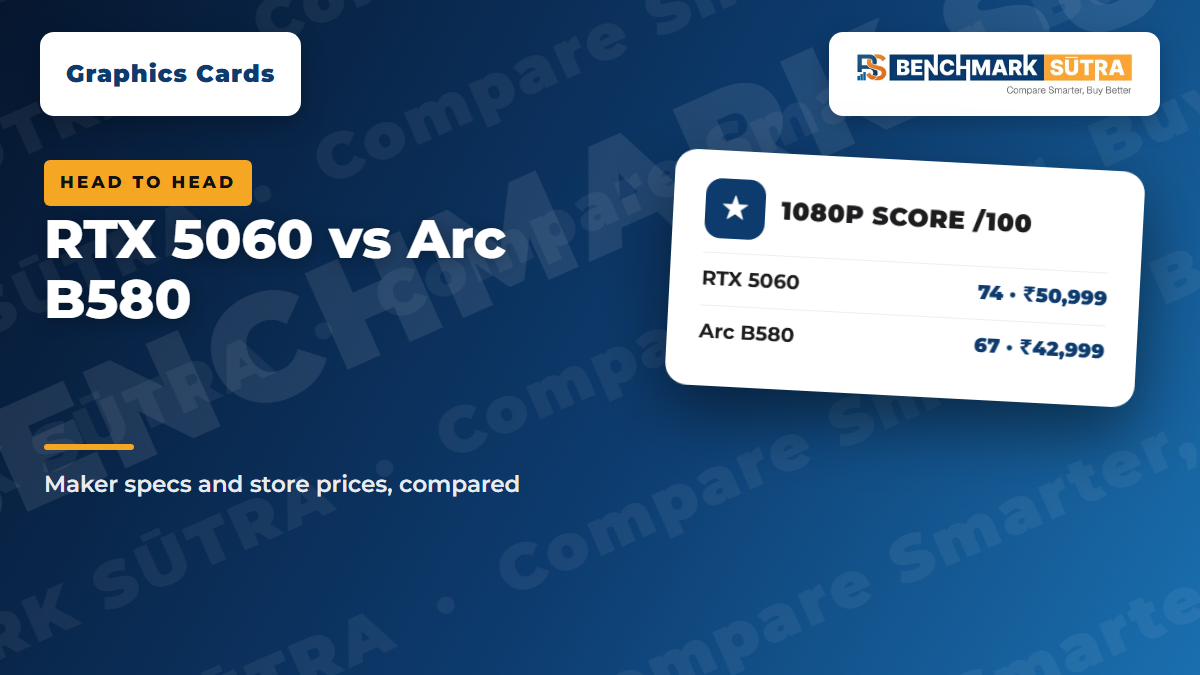
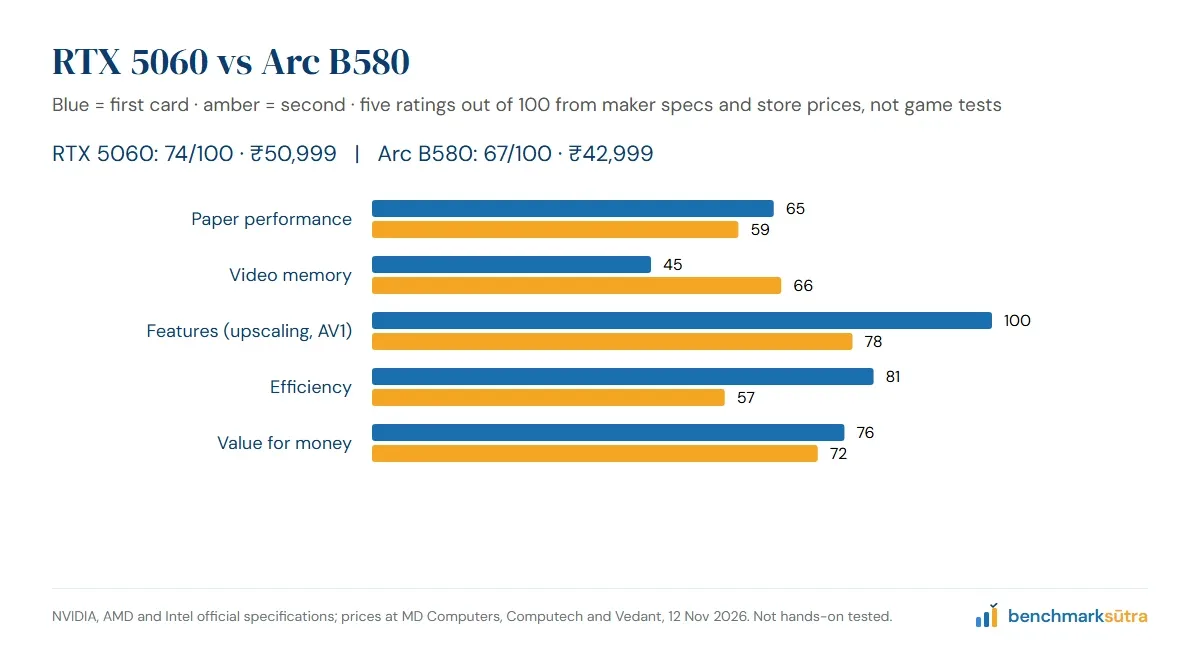
RTX 5060 wins on our 1080p score: 74/100 · B tier against 67/100 · C tier. The Arc B580 is ₹8,000 cheaper at our stores (₹42,999).
Researched, not hands-on tested. Scores come from NVIDIA, AMD and Intel specifications and the prices at our partner stores, checked 12 November 2026. We did not run games or measure frame rates. How the GPU Score works.
Specs side by side
RTX 5060 | Arc B580 | |
|---|---|---|
Video memory | 8 GB | 12 GB |
FP32 compute | 19.2 TFLOPS | 13.7 TFLOPS |
Memory bandwidth | 448 GB/s | 456 GB/s |
Board power | 145 W | 190 W |
Upscaling | DLSS 4 | XeSS |
AV1 encode | Yes | Yes |
Recommended PSU (chip maker) | 550 W | 600 W |
Cheapest price | ₹50,999 | ₹42,999 |
Ratings
Rating | RTX 5060 | Arc B580 |
|---|---|---|
Paper performance | 65 | 59 |
Video memory | 45 | 66 |
Features (upscaling, AV1) | 100 | 78 |
Efficiency | 81 | 57 |
Value for money | 76 | 72 |
1080p score | 74 | 67 |
Who should buy which
Buy the RTX 5060 if you want the higher score. It costs ₹8,000 more.
Buy the Arc B580 if you want to save money.
The two boards we compared
INNO3D RTX 5060 Twin X2 OC V2 8GB GDDR7 SFF
8 GB video memory · 19.2 TFLOPS FP32 · 448 GB/s memory bandwidth · 145 W board power · upscaling: DLSS 4 · AV1 encode: yes
Board: 225 mm long · 2-slot · power: 1x 8-pin · 550 W recommended PSU · 3x DP 2.1b, 1x HDMI 2.1b (INNO3D).
Where to buy: Buy at Computech ₹50,999 · Buy at Vedant Computers ₹56,300 · Buy at MD Computers ₹57,069
ASRock Intel Arc B580 Challenger 12 OC
12 GB video memory · 13.7 TFLOPS FP32 · 456 GB/s memory bandwidth · 190 W board power · upscaling: XeSS · AV1 encode: yes
Board: 249 mm long · 2-slot · power: 1x 8-pin · 650 W recommended PSU · 3x DP 2.1, 1x HDMI 2.1a (ASRock).
Where to buy: Buy at Computech ₹42,999
How to read these scores
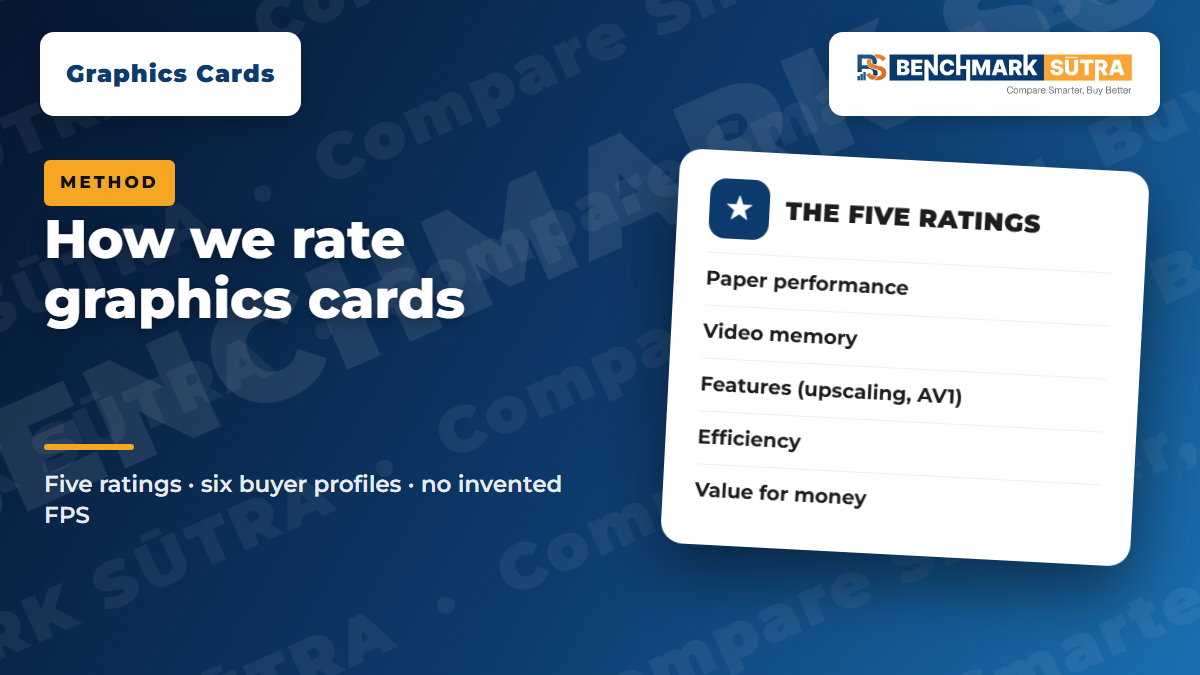
Every card gets five ratings out of 100: paper performance, video memory, features, efficiency and value. Each buyer profile weights them differently, and the weighted total is the score. Tiers: S 90+, A 80–89, B 70–79, C 60–69, D below 60. Paper performance is the square root of FP32 TFLOPS × memory bandwidth, both from the chip maker. It ranks raw capability; it is not a frame rate. It does not capture ray-tracing strength, driver quality or noise. AMD quotes peak FP32 with dual-issue, so Radeon cards can look a little stronger on paper than they play. Read the full method.
Related graphics card guides
Best Graphics Card in India (Nov 2026): Picks from ₹20,000 to ₹10 Lakh
Best Graphics Card for AI and Video Editing in India (Nov 2026)
Prices change frequently. The prices on this page were correct when we wrote and checked it, but they may have changed by the time you read this. Check the current price on the retailer's page before you buy.
We may earn a commission from some links on this page. It never affects our scores.