
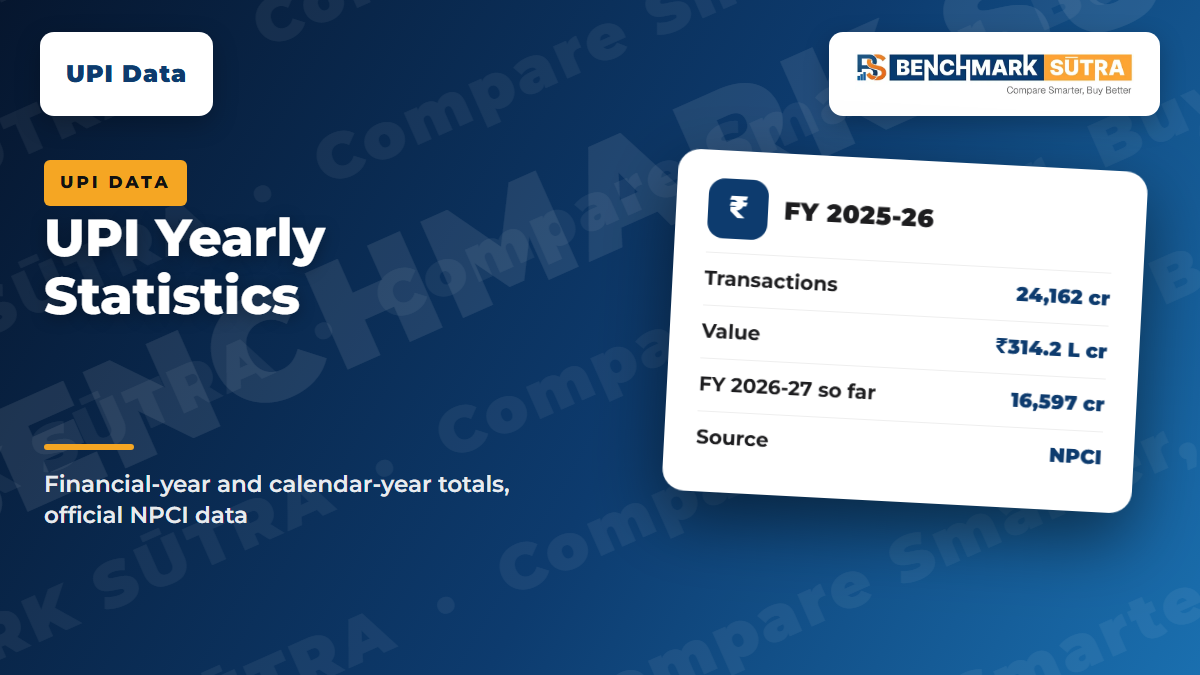
UPI volume and value by financial year (April–March) and calendar year, from NPCI. FY 2025-26: 24,162 crore transactions.
Quick Answer
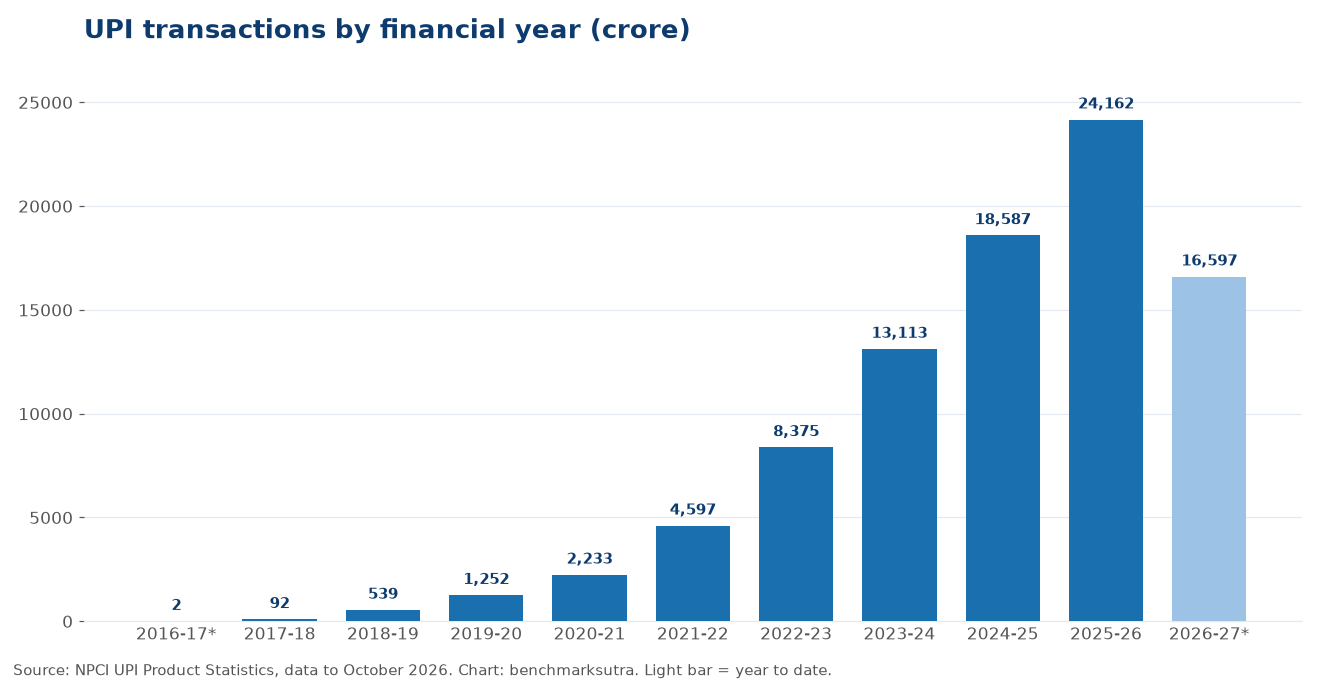
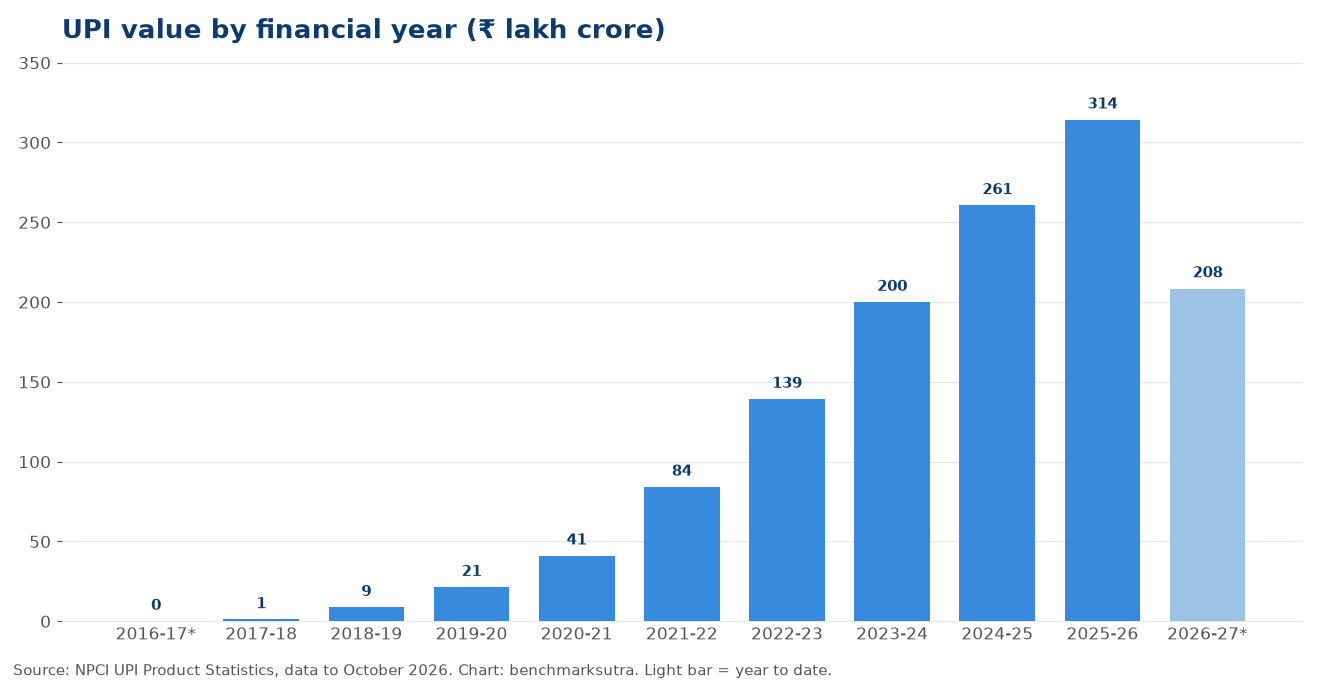
In FY 2025-26 (April to March), UPI processed 24,161.69 crore transactions worth ₹314.23 lakh crore (NPCI). FY 2026-27 so far (April–October) stands at 16,596.72 crore transactions worth ₹208.46 lakh crore.
Picking a card? See our scored picks
Best RuPay credit cards for UPI · Credit card on UPI explained
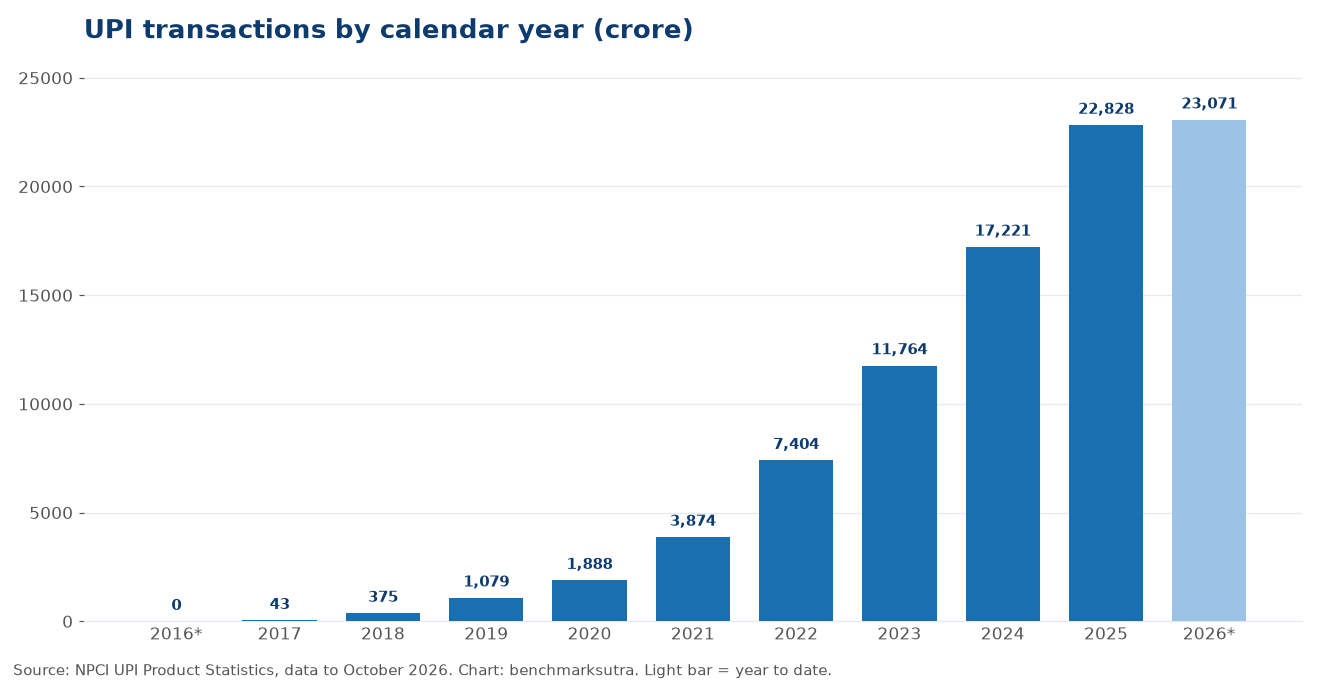
Financial years run April to March; calendar years run January to December. * marks a partial year: FY 2016-17 and 2016 start in July 2016, when UPI went live, and the latest year runs only to October 2026. Data as of October 2026. Source: NPCI.
UPI by financial year (April–March)
UPI by calendar year (January–December)
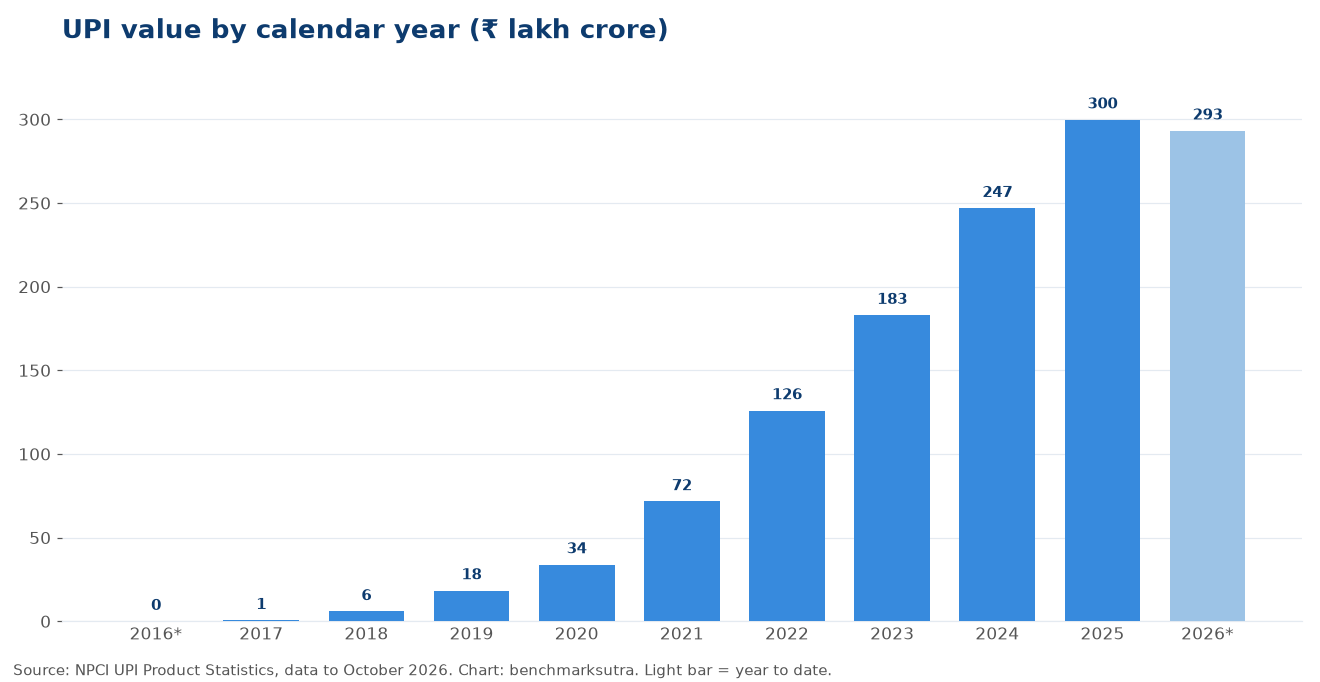
Month by month: UPI monthly statistics. Latest month summary: UPI transaction statistics.
Official Sources
Source: NPCI UPI Product Statistics (National Payments Corporation of India), monthly data. Data as of: October 2026, the latest month NPCI has published. Page checked: 9 November 2026.
NPCI reports volume in millions and value in ₹ crore. We convert volume to crore (1 crore = 10 million) and value to ₹ lakh crore (1 lakh crore = 1,00,000 crore). Average ticket size = value ÷ volume. This tool is connected to NPCI’s published data: we check it every week and refresh the figures when a new month is published, usually in the first few days of the next month.